
Over the past few months I have been watching our government change from a constitutional democracy to an oligarchy. While this is very serious and disturbing to me, I think what I’m seeing is the result of changes in our society and government that have been building for many years, and any fix is going to require fundamental changes in both of these systems. In this article I’m going to go back through my working life and discuss the changes I’ve seen that I think got us into the mess our country is in and some thoughts on how we might get out of it. The article in two parts, un-creatively named: How Did We Into This Mess? and How Do We Get Otta This Mess?
How Did We Get Into This Mess?
I used the social and political changes I’ve seen my working life as a timeframe to analyze the social and political changes that have occurred over this time, and have identified three major events that I think are major causes of our current economic and political situation: Wage Stagnation, Wealth Gap, and Big Money Influence.
Wage Stagnation
Wage stagnation occurs when wages increase at lower rates than inflation. The government deals with this by increasing the minimum wage, and private industry deals with it by increasing employee wages.(1)
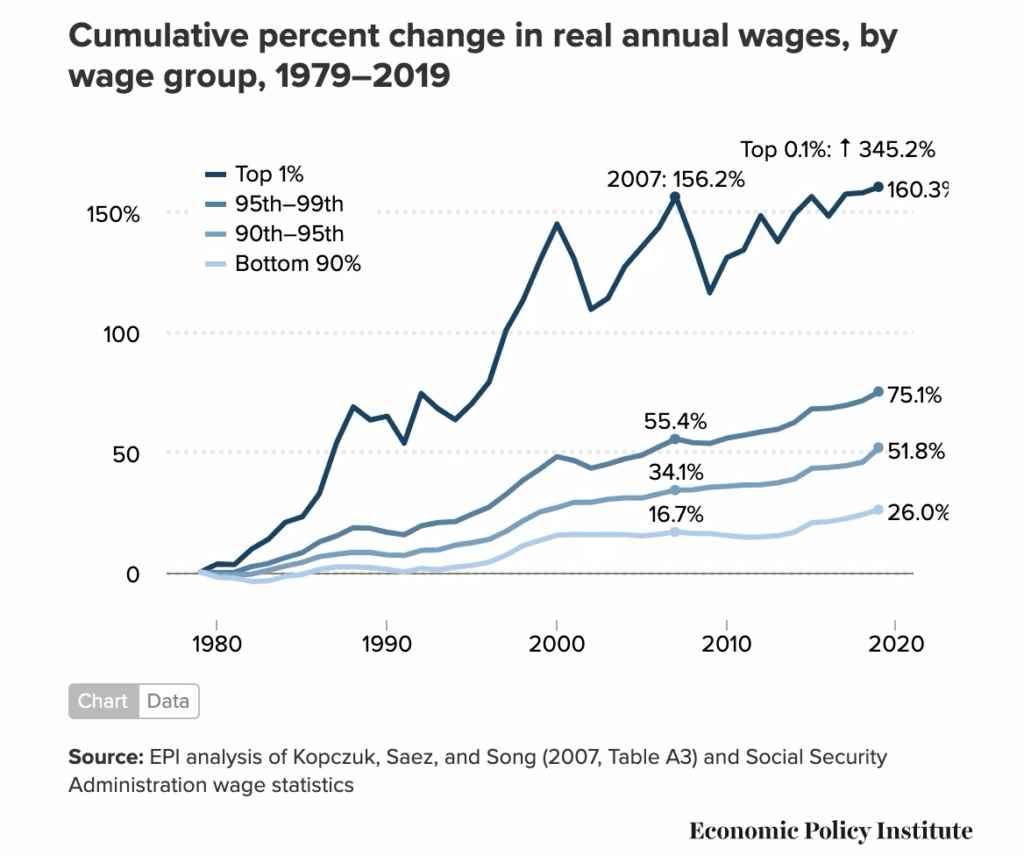
The two charts below show the percent change in annual wages over a similar time period. The top chart covers the 40 year period 1979-2019, and shows the percent change in annual wage groups of the top 1%, the top 90%-95%, and bottom 90% of the workforce. Note that the line in the top chart ends with the top 1% wage group, and the top 0.1% is way off the chart at 345.2%.
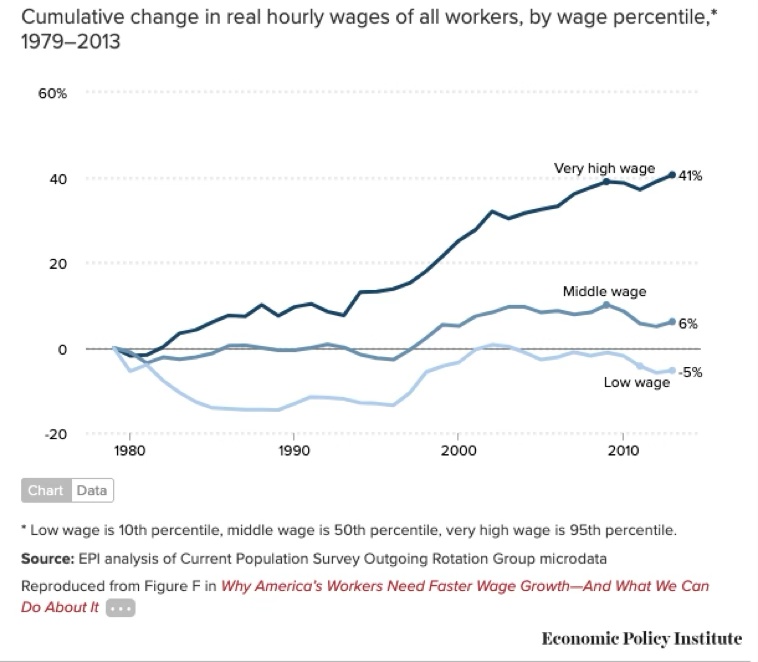
The bottom chart covers the 34 year period 1979-2013 and shows the wage changes percentiles rather than percentile group from the Very high wage of 95th percentile, a Middle wage 50th percentile, and Low wage 10th percentile. This chart gives a better picture of the changes in the bottom 90% of workers’ wages.
The two charts present very different pictures of the top and bottom 90% of workers over the past 40 some years. The top chart shows the top 0.1% and 1% of wage earners have done very, very well, and those in the top 90% have done well. Even those in the bottom 90% have seen 26.0% increase.
The bottom chart gives a more detailed look at the lower 90% of the wage earners. Very high wage earners, those earners in the 95th percentile, saw substantial wage gains, while those in the 50th percentile or below saw either little gain or lost wages. In other words, over half of all workers saw little gain or no wage gain during the 34 year period.
Like much research in social science, you can find a study that will support any argument you want to make. I picked a study from a reputable institute, but there are also studies that found there was either no wage stagnation, or that workers’ real wages increased.(1a)
As a personal example of wage stagnation, in 1956 when I was a senior in high school, I was able to get into the Laborers and Hod Carriers Union and had a summer job at $3.75 an hour. Minimum wage, which defined the poverty-level income at that time, was $0.75 an hour. So I was earning five times the poverty-level pay. The 2024 construction labor wage in California was $23.44/hr., and the minimum wage was $16.60/hr. So an entry-level worker doing the same work today that I was doing almost 70 years ago would make just over one percent over poverty level. If union labor wages kept pace with inflation, current hourly wage for a construction laborer would be $83.00.
Wealth Gap
Wage earners prepare for retirement by saving money and buying things during their working life that will gain in value. Economists call these things assets, and for most of us our major asset is our home. Buying a home at a young age is important economically because debtors benefit from an inflationary economy. If you make enough money to buy a home with a 20-30 year mortgage, you will pay it off with inflated money, and your home will be paid for by the time you retire. If you have to rent a home because you can’t afford to buy, you will see your rent go up and your wages go down in inflated dollars, and will have less money to retire on.
Wealth is the sum of person’s assets minus their liabilities, and is considered a better indicator of a persons wellbeing than earnings. The major asset for most people is the value of their home minus their mortgage.
The chart below only goes back to 2009, but it gives an excellent illustration of the Wealth Gap between various income levels over the last 15 years. The top 0.1% of Americans have done very, well, and the top 99-99.9% have done well. The chart also shows that 40% (the 50%-90% bracket) have gained slightly. However, the bottom 50% of our population (the tiny flat yellow line at the bottom of the chart) has seen almost no gain in wealth for the past 25 years. That means they are renting their home or still paying off their mortgage, and worried about how they will pay for their health care or retire.

Big Money Influence
I want to be clear that Big Money Influence has little to do with wealthy people. Wealthy people just make more money, own more stuff, and pay more taxes than the rest of us. They were also the people who kicked in over 90% of their top-tax-bracket income to help us fight World War II and the Korean war. I use Big Money Influence as a term to describe people and organizations that use their wealth to influence our political system. A better term for them might be oligarchs.
Big Money has been involved with our politics throughout our country’s history, and government efforts have generally controlled it. I think the road to oligarchy started when Big Money convinced the U.S. Supreme Court that organizations were people and that money talked. Therefore giving money to politician or political candidates should be considered free speech. In 1943 Political Action Committees (PACs) were created. These are voluntary organizations that can raise money for candidates(2). PACs, and now Super PACs, can spend unlimited amounts of money on political candidates and political propositions.
There were two major Supreme Court cases that paved the way for Big Money. First was Buckley v. Valeo(3) in 1976 that ruled limits on election spending are unconstitutional because spending limits reduce free speech. I’m sure you’ve heard the phrase, Money talks and BS walks. Well the Supremes’ decision made this law. The Court ruled, “While contributions could be limited in order to avoid corruption, or the appearance of corruption, spending by individuals or groups or by candidates themselves (from their own personal resources) could not corrupt elections and should not be limited under the First Amendment.” This distinction between contributions and spending remains a linchpin of campaign finance law.
The Supreme Court’s thinking on separating contributions from spending on elections as free speech was based on the idea that contributions might involve asking for favours in return if the candidate won (called quid pro quo in legalise) whereas contributing money to a candidate’s campaign had no quid pro quo. I think this thinking is flawed for two reasons: 1. Spending more money on an election campaign isn’t like speaking freely in a louder voice. It is buying more exposure in different print, TV, and other media, holding more political rallies, etc. 2. It is naive to think there is no quid pro quo implied in large corporate or PAC spending on candidates’ campaigns.
The research I found on campaign spending by House and Senate candidates indicated that campaign spending helped win elections. In all 13 House and Senate elections since 2000, the top spending House candidates won 72%-85% of the time, and top spending Senate candidates won 86% to 97% of the time.(3a)
The second Supreme Court case that helped Big Money was Citizens United v. Federal Election Commission case in 2007(4). In this case the Court supported the Buckley v. Valeo decision and ruled that limiting the amount of money corporations and other special interest groups could spend to influence voters was a violation of their free speech rights. The Citizens United decision allowed Political Action Committees, PACs, and Super PACs to spend unlimited amounts of money to support political candidates.
While Big Money has had a voice in our government throughout our history, it’s voice became much louder with Buckley and Citizens United Supreme Court decisions that corporations and PACs have free speech rights, and spending money to get politicians or political candidates elected is free speech.
Finally, I have argued that growing wage and wealth disparity and the influence of Big Money on our politics have seen our country change from a constitutional democracy to an oligarchy. I think the fact that our current President was able to kick in $66 million of his personal money to his election campaign; that his key advisor is the richest person in the world; that this administration has stacked the U.S. Supreme Court with appointees, and that the U.S. Legislature is ether supportive or running for cover supports my argument.
If you are even somewhat in agreement with me so far, you might be asking,
How Do We Get Outta This Mess?
It took us many years to make the mess, and it will take some time to clean it up. Below are some ideas thoughts that might get us started.
Where do we get the money?
I think the best advice came from Willie Sutton, a bank robber in the 1930s to 1950s who was famous for robbing banks, getting caught, going to prison, getting out, and robbing banks again. When asked why he kept robbing banks, he said, “That’s where the money is.” So since the rich folks have the money, we ask the them to help their country again. The current top income tax bracket is $626,350 with a tax of 37%. We could create a two or three higher brackets that start at $1,000,000 with a tax rate of 80%-90%.
Create a federal wealth tax(5).
Unlike some of Latin American and European countries, the US taxes only income and not wealth. We pay a wealth tax on worldwide assets here in Spain, and I have to admit it does take a bite, but medical care is free, and I can count the number of homeless people in I’ve seen the past three years on one hand.
Fix our wage and wealth gap
Bring back unions. Maybe this time in a less adversarial relationship with management.
Create more jobs
Recreate the Works Progress Administration (WPA). This program got us out of the Great Depression, so it might work again.
Bring back obligated government service
Programs like Americorps, Peace Corps, and the military not only do good work and provided jobs for people, they also exposed young people who were generally raised in economically and racially isolated communities to people of different incomes, lifestyles, and cultures.
Get Big Money Influence out of politics
This task will be tough. We need to limit spending and contributions to political candidates by both people and organizations.
Election campaigns could be funded by the government so all candidates get equal exposure. We could limit personal donations to politics to under $1,000.00, and eliminate corporations, PACs, or any organizations or individuals from endorsing or funding candidates. As a start, we have to convince the Supreme Court that corporations aren’t people and that money is really different than speech. If that won’t work, we have to amend the Constitution.
Other countries obviously have the same challenges of keeping Big Money out of politics. In the United Kingdom political parties are given free air time on radio and TV and are not allowed to charge for advertizing political parties and other political organizations.
Finally, adapt what other countries have done
European and Latin American countries have a much longer history of dealing with oligarchs than the US, and many have done very well. Inequality in European countries is way lower than the US, most European countries have higher union membership than the US ,and seem to have a less adversarial relationship with management. In the United Kingdom political parties are given free air time on radio and TV and are not allowed to charge for advertizing political parties and other political organizations.
Finally, finally, solutions to this mess will go beyond current party differences,
and we will need to be united in whatever we do. This won’t be easy; oligarchs tend not to leave office just because they were voted out, so the cleanup might be messy..
References
1. Wage Stagnation: https://www.epi.org/publication/charting-wage-stagnation/
2. Political Action Committees: https://www.opensecrets.org/political-action-committees-pacs/2024
3. Buckley v. Valeo: https://www.oyez.org/cases/1975/75-436
3a. Campaign spending: https://www.opensecrets.org/political-action-committees-pacs/super-pacs/2024
4. Citizens United: https://www.brennancenter.org/our-work/research-reports/citizens-united-explained
5. Wealth Tax: https://www.pgpf.org/article/what-is-a-wealth-tax-and-should-the-united-states-have-one/
Other sources used
Winning v Spending article: https://www.opensecrets.org/elections-overview/winning- vs-spending
Tax Brackets: https://www.fidelity.com/learning-center/personal-finance/history-us-income-tax
Inflation Rate Graph: https://www.usinflationcalculator.com/inflation/historical-inflation-rates/
InflatIon Rates 1035 to 2025: https://www.officialdata.org/us/inflation/1935?amount=31725&endYear=2024
How inflation rate affects personal finances: https://lautorite.qc.ca/en/general-public/personal-finances/inflation-and-its-impacts-on-your-finances
Median age of homebuyers: https://www.resiclubanalytics.com/p/the-vanishing-young-homebuyer-median-first-time-homebuyer-age-jumps-from-28-in-1991-to-38-in-2024
CEO to Worker Compensation: https://www.epi.org/publication/ceo-pay-continues-to-rise/
Executive vs. worker pay: https://aflcio.org/paywatch
Buckley v Valeo: https://www.demos.org/sites/default/files/publications/buckley_at_40%20%282%29.pdf
Prop 22: https://www.opensecrets.org/ballot-measures/CA/2020/50168797/summary
Pie Institute for International Economics: https://www.piie.com/microsites/how-fix-economic-inequality
Campaign finance: https:/en.wikipedia.orgwikiCampaign_finance_in_the_United_States
CA Minimum wage 1956 and 2018: https://www.dir.ca.gov/iwc/minimumwagehistory.htm
Citizens United: https://www.brennancenter.org/our-work/research-reports/citizens-united-explained
Civil Conservation Corps (CCC): https://en.wikipedia.org/wiki/Check_dam
Cost of living index changes over time: https://www.usinflationcalculator.com/inflation/consumer-price-index-and-annual-percent-changes-from-1913-to-2008/
Construction industry membership 2024: https://www.bls.gov/news.release/pdf/union2.pdf
Construction industry membership 1983-2025: https://unionstats.com/
Gerrymandering: https://www.brennancenter.org/our-work/research-reports/gerrymandering-explained
Great Depression: https://www.britannica.com/event/Great-Depression/Political-movements-and-social-change
Great Depression causes: https://www.britannica.com/story/causes-of-the-great-depression
Inflation rate graph 1914-2025: https://www.usinflationcalculator.com/inflation/historical-inflation-rates/
Inflation: https://bipartisanpolicy.org/explainer/inflation-measurement/
2025 Rental prices in LA: https://www.laalmanac.com/economy/ec40.php
Minimum wage by state: https://www.dol.gov/agencies/whd/minimum-wage/state
Top Tax bracket Rate sates 1938-2013:
https://files.taxfoundation.org/legacy/docs/fed_individual_rate_history_nominal.pdf
History of Federal Income Tax Rates 1913-2025: https://bradfordtaxinstitute.com/Free_Resources/Federal-Income-Tax-Rates.aspx
Oligarchy: https://en.wikipedia.org/wiki/Oligarchy
Open Secretes Campaign contributions: https://www.opensecrets.org/2024-presidential-race/donald-trump/candidate?id=N00023864Top tax bracket rates 2024
Trade union membership 1897-1962: https://www.nber.org/system/files/chapters/c1707/c1707.pdf
Treasury Dept Income Inequality: https://home.treasury.gov/news/featured-stories/labor-unions-and-the-us-economy
Union membership by year: https://www.dailysignal.com/2013/01/27/chart-of-the-week-union-membership-continues-to-decline/
U.S. Census Poverty levels 1959-2023: https://www.census.gov/data/tables/time-series/demo/income-poverty/historical-poverty-people.html
Wealth distribution. Current: https://usafacts.org/articles/who-owns-american-wealth/
Wealth distribution chart: https://www.federalreserve.gov/releases/z1/dataviz/dfa/distribute/chart/
Wealth Inequality Charts: https://apps.urban.org/features/wealth-inequality-charts/
Checks and balances in the Constitution: https://constitution.congress.gov/browse/essay/artI-S1-3-1/ALDE_00013290/
History of Income taxes in the U.S.: https://www.investopedia.com/articles/tax/10/ history-taxes.asp
First-Time Home Buyers Shrink to Historic Low of 24% as Buyer Age Hits Record High: https://www.nar.realtor/newsroom/first-time-home-buyers-shrink-to-historic- low-of-24-as-buyer-age-hits-record-high
Who is Open Secrets: https://en.wikipedia.org/wiki/OpenSecrets
Money in Politics: https://www.opensecrets.org/resources/learn/timeline
Other countries ways of dealing with campaign financing: https://www.ifes.org/sites/default/files/migrate/campaign_finance.pdf